Home Run Style: Represent Your Team with the Ultimate Baseball Fan Shirt

Baseball season is here, and it’s time to gear up and represent your team! Whether you’re heading to the ballpark or watching the game from the comfort of your own home, there’s no better way to show your team spirit than with a fan shirt. But with so many options out there, how do you choose the perfect one? Here are some tips on how to create the ultimate baseball fan shirt and show your team some love.

Represent Your Team with the Ultimate Baseball Fan Shirt

Choose Your Colors Wisely

When it comes to fan gear, color is key. Pick colors that represent your team and make you stand out in a crowd. You can go with the classic team colors, or mix it up with some fun combinations. For example, if you’re a Toronto Blue Jays fan, you can go with blue and white, or add some pops of red for a patriotic twist. If you’re a fan of the Los Angeles Dodgers, you can stick with their classic blue and white, or add some yellow for a sunny California vibe. Whatever colors you choose, make sure they’re bold and eye-catching.

Get Creative with Graphics

The graphics on your fan shirt are another important element to consider. You can go with a simple team logo or mascot, or get more creative with custom designs. Maybe you want to incorporate your favorite player’s name and number, or add some fun baseball-related phrases or puns. The possibilities are endless, so get creative and make it unique. (more…)

Get Your Child Started with Baseball

In high school, sports are a very vital aspect of every student’s life. At this point, most children choose their preferred sport to engage in with their peers. However, it’s not easy giving your children the desired backing that they deserve in sports, especially when you don’t know the sports too well. Take, for instance, baseball; it’s essential to know about the sport to give your kids the proper backup they need. Most parents do not know how to support their children in sports but cheer up if you belong to this category.

Get Your Child Started with Baseball

In this article, I will discuss how you can get your child started with baseball. Getting your child started with baseball is not about just going to the match to support carrying your custom team banners; there’s more you can do for him than just being a regular supporter at a baseball event.

Things to Prepare When Letting Your Child Play Baseball

Here are some suggestions on how to get your child started with baseball:

Help them gear up professionally

It is very vital to help equip your child for the new baseball season by making sure that he’s got all the necessary gear required to get him started. Since baseball has multiple gears needed for the sports, you could start by getting him some basics like a baseball glove and a softball. It is vital to get started with these two gears; there’s nothing more exciting for a baseball kid than having his baseball glove. Since your kid isn’t yet an adult player, you might also want to include some baseball cleats; however, this may not be necessary when they come of age. A small bat and a pair of baseball shoes could also do the trick to complete your children gearing up. It is also essential to get your child a bag for carrying all their baseball gear to a baseball event like a training section or a baseball competition. (more…)

Uniqueness of Soccer Banners

Many people complain that crafting the best soccer banner is often a barrier, but this can be solved.

Having understood the request of your supporters, then you will be able to provide the tactics to make a custom sports banner.  A wrong soccer banner can affect your game because it is difficult to use a lousy soccer banner to spread the sports slogan. A custom banner helps people to spread the team slogan and entertain themselves.

The match can be appealing if all the players try their best to win the game. Meaningful pictures and slogans on the soccer banner will make the players feel comfortable. The soccer banner also contains much versatility and modalities.

When trying to draw people’s attention, a piece of information can be on the soccer banner. Some banners have no slogans, but it still gives an illustrated piece of information about the game. Banners motivate players while on the field. Soccer banners can be in a printed pattern to make it easy and straightforward to access.


A custom sports banner is a symbol of creativity, with illustrated information on it. A banner is also used by fans to encourage their supported team or game. Therefore, banners can be shown at any other event center and location. Using a banner will improve the player’s concentration, persistence, and discipline skills.

Simple Tips for creating soccer banners

Get Creative ideas

It would be best if you had an excellent idea before designing a banner for your sport. Many exciting ideas, non-informative slogans, and hard products are used by most clients when designing a sports banner. Therefore you must opt for good banners that can be read, understood, and informative. (more…)

The Best Basketball Team Needs to have the Best Sports Banner

You may have probably created the dream team every basketball coach dreamt of. Your basketball team this season may have all the ace players in the whole town and you can’t wait to let everyone know that your team is the one to bag the championship this season, but did you know that more than just bragging and telling stories to your friends and everyone you know that your team is the best team, you can also do that by ordering a sports banner.

Basketball Sports

What is a Basketball Sports Banner?

If you are a real basketball fan, you can easily say that a basketball banner is a must-have in all basketball events, it is a banner that is usually present in the entire basketball court containing the team’s name, coach, players and logo. It is a good way of introducing your favourite team and also it raises the awareness of the basketball fans of the team’s players and their numbers. If you have a basketball sports banner, you are making it easy for the players to be known in the court thus, they are becoming famous even before the game starts. (more…)

2014 Steamer Projections – Starting Outfielders

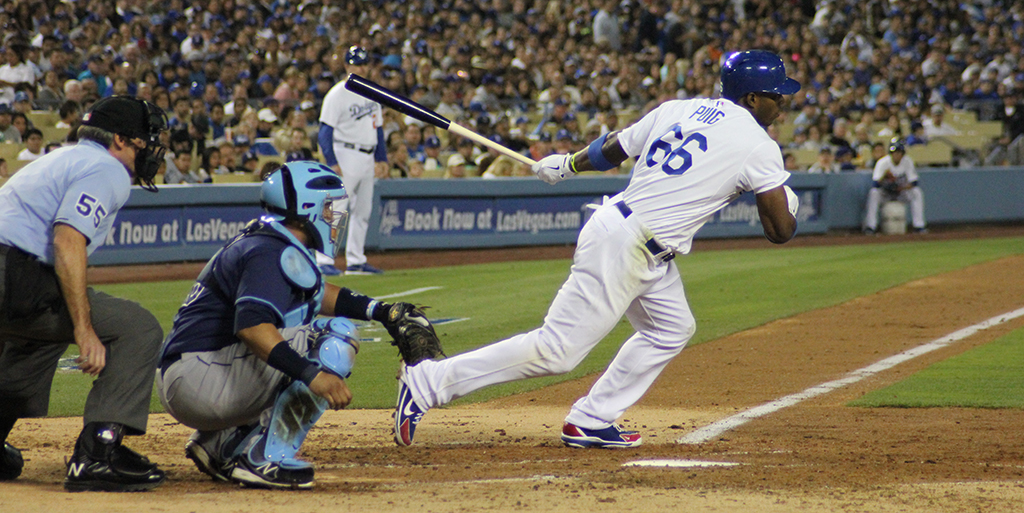
Puig Cropped

Projecting the performance of the Dodgers’ 2014 starting outfield is a difficult task. If the season started today, the Dodgers would have four major league quality outfielders fighting for three spots. Trade rumors are still swirling around Matt Kemp and Andre Ethier in particular, so there’s a strong possibility that these numbers will change significantly before opening day. The Dodgers had the same theoretical problem last year, but it didn’t really impact playing time, since outfielder was almost always injured.

There’s also Joc Pederson and Scott Van Slyke, but they’ll be covered in a separate piece on bench/minor league contributors after those portions of the rosters get more set.

The format remains the same as the last Steamer projections post. First, I’ll show a comparison between the player’s 2013 statistics and their 2014 Steamer projection. I’ll then describe the specifics of the projection, then I’ll predict if the player will finish over or under the projected WAR total and explain the rationale behind my prediction.

I’m adding my own predictions because these projection systems can be flawed or based on different assumptions than what I have. It might be fun to revisit the accuracy of these predictions against the projections after the season is over. As we all know, predicting baseball is very difficult, so I don’t have much confidence in my predictions over the projections.

Matt Kemp

Season

PA

HR

SB

BB%

K%

ISO

BABIP

AVG

OBP

SLG

wOBA

wRC+

BsR

Off

Def

WAR

2013

290

6

9

7.6 %

26.2 %

.125

.353

.270

.328

.395

.316

103

1.7

2.7

-15.3

-0.4

2014

567

22

13

9.2 %

24.3 %

.192

.329

.271

.342

.464

.346

125

0.4

16.1

-6.4

2.9

Projection Synopsis: Steamer projects a huge rebound for Kemp, expecting him to maintain consistent playing time while producing better power and walk numbers than his disastrous 2013 campaign. Even with this rebound, the numbers here most closely resemble his full 2012 season and not the better numbers that he produced before.

Over/Under prediction: Sigh. I want to be wrong so badly, but I have to take the under. I have serious doubts about his ability to stay healthy for a full season, and I think his speed numbers and defensive value will be lower than what is projected here due to the ankle and hamstring injuries that he suffered last season. Like I said, I badly hope that I’m wrong, because Kemp is so amazing to watch when he’s healthy.

Andre Ethier

Season

PA

HR

SB

BB%

K%

ISO

BABIP

AVG

OBP

SLG

wOBA

wRC+

BsR

Off

Def

WAR

2013

553

12

4

11.0 %

17.2 %

.151

.315

.272

.360

.423

.340

120

0.5

13.2

-2.7

2.9

2014

444

12

3

9.9 %

18.3 %

.162

.310

.269

.348

.431

.338

119

-0.7

8.7

-1.1

2.3

Projection synopsis: Steamer projects that Ethier will be the outfielder who loses the most playing time due to the outfielder surplus. That’s probably true, if everybody remains healthy. It predicts a slight increase in power and a slight reduction in walk rate, resulting in wRC+ and wOBA values very similar to what he managed last season.

Over/under prediction: Over, for several reasons. I think the playing time estimates for both Kemp and Crawford are high (given higher likelihoods of injury), which hurts Ethier’s projected value. If Ethier’s playing time does end up being this low, I think his offensive numbers will be higher since he’ll be facing fewer lefties. The defensive value being projected here is probably a bit higher than what I’d expect, because I’m a bit skeptical of how the advanced defensive metrics graded him last season. But the reduction in defensive value can potentially be offset by an improved offensive performance. That is, unless he’s traded.

Carl Crawford

Season

PA

HR

SB

BB%

K%

ISO

BABIP

AVG

OBP

SLG

wOBA

wRC+

BsR

Off

Def

WAR

2013

469

6

15

6.0 %

14.1 %

.124

.321

.283

.329

.407

.322

108

5.0

9.1

4.0

2.9

2014

570

12

18

6.3 %

15.7 %

.140

.309

.274

.324

.414

.322

108

2.0

7.0

-3.4

2.2

Projection synopsis: Steamer is projecting a reduction in BABIP and an increased strikeout rate, but an increase in power, which results in precisely the same wOBA and wRC+ as he produced last season. Increased playing time, but reduction in defensive value combine to produce a WAR that is about 0.7 lower than 2013.

Over/under prediction: Under. This projection was probably the hardest for me to guess, since I think all of the assumptions are just about right. The increase in power makes sense. Crawford’s career ISO is .147 and the above table don’t include postseason numbers, when Crawford hit four homeruns.

The defensive value drop, which is the biggest change, makes some amount of sense. Defensive metrics were very split on their evaluation of Crawford last season. Crawford had a UZR (ultimate zone rating) of 8.6 runs above average. However, he had a DRS (defensive runs saved) of only 1 run above average. While the UZR is pretty close to Crawford’s career level and DRS is lower, Crawford’s hamstring injury last year may have impacted his performance. Defensive metrics are so fickle that it’s hard to tell what’s right and what’s not.

I ended up taking the under (after a lot of deliberation) because I think the PA count is too high. It’s almost a sure bet that Crawford will miss at least some amount of time due to injury next season. But I could have gone either way on this one.

Yasiel Puig

Season

PA

HR

SB

BB%

K%

ISO

BABIP

AVG

OBP

SLG

wOBA

wRC+

BsR

Off

Def

WAR

2013

432

19

11

8.3 %

22.5 %

.215

.383

.319

.391

.534

.398

160

-4.2

25.1

-0.7

4.0

2014

618

26

20

8.5 %

19.9 %

.211

.330

.290

.359

.502

.370

141

-1.8

26.9

-3.3

4.5

Projection Synopsis: Puig’s Steamer projection expects him to maintain the walk rate and power that he displayed over the course of last season, with a slightly reduced strikeout rate. It projects an overall drop in his offensive value, mostly due to a steep drop in BABIP. It expects his defensive value to be slightly lower, but also expects his baserunning value to be slightly higher.

Over/under prediction: Over. Taking the “over” on a 4.5 win projection is bold, but there are a few factors that cause me to think that the projected value is a bit low. The first is the steep decline in BABIP. The likelihood of Puig matching his 2013 BABIP is low, but his skillset still makes a .330 projection a bit too low. Puig seems like the only outfielder who will be playing every day when healthy, so I think the plate appearance count here is potentially low (barring injury, of course). The projected walk rate might also be a bit low, since his overall walk rate increased dramatically throughout the course of last season.

Additionally, I think that the decline in defensive value here is a bit unusual. Puig has looked anywhere between lost and amazing on defense, but I can’t understand why Steamer is projecting a decline. The magnitude of the projected decline is small (2.6 runs), but it’s puzzling.

Put all of that together, and I think Puig is set up for a great sophomore season. Potentially MVP level, even.

Overall

2013 outfield (primary starter) fWAR: 9.4

2014 outfield (primary starter) fWAR: 11.9

Conclusions: Steamer is projecting an increase of about 2.5 wins from the starting outfield group in 2014. This is mainly due to an increase of 3.3 wins from Matt Kemp. If Kemp can rebound with the magnitude that is projected here, it will be a huge boost to the Dodgers’ ability to contend in the 2014 season. While these projections are still fluid (based on a roster that is not yet complete), it is still encouraging that at least one projection system is predicting a rebound of this magnitude.


J.P. Howell Signs for Less Than Expected

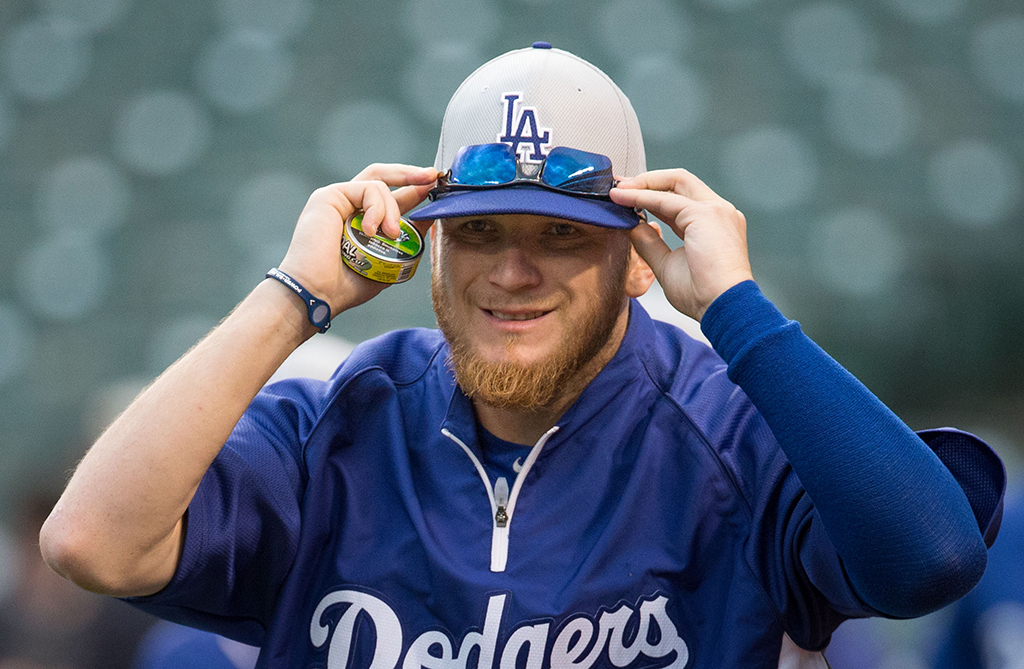
Los Angeles Dodgers at Baltimore Orioles April 19, 2013

Last night, it was reported that J.P. Howell will re-sign with the Dodgers. According to reports, Howell will get 2 years, 11.5 million guaranteed, with a third year mutual option that becomes a player option if Howell makes 120 appearances in the next two years. The contract terms seem reasonable, given Howell’s great 2013 season. But, his 2013 season was a bit of an outlier. Whether or not the changes are real will determine if this contract will be worth it.

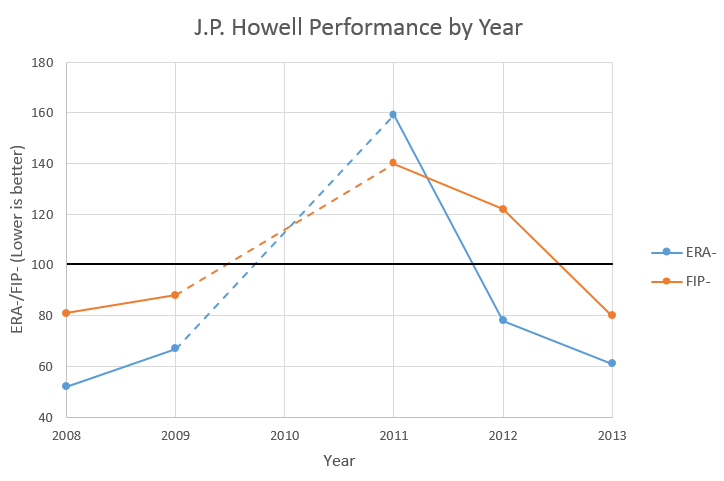
Here are Howell’s overall results (ERA- and FIP-) since he was converted to a reliever in 2008:

FIPERA

The first thing to note is the missing data from 2010. Howell missed all of that season with shoulder surgery. The second is the jump in ERA- and FIP- following the surgery. Lower is better on these numbers, and 100 (shaded darker) is league average. 2013 was the first season Howell was better than league average on both ERA- and FIP- since before the surgery.

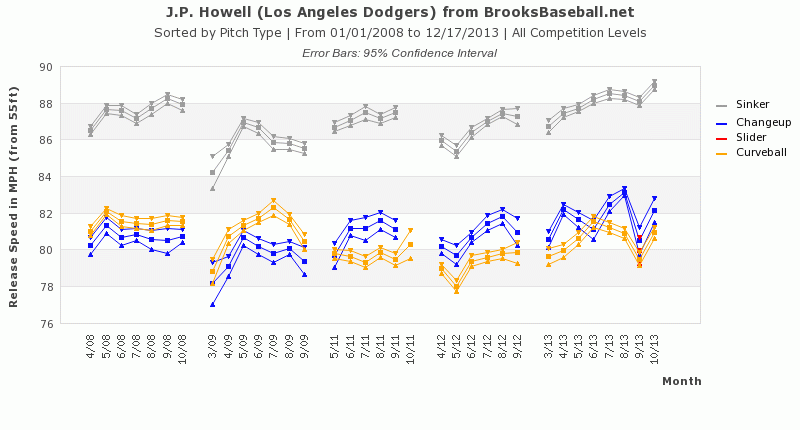
So, what changed in 2013? First of all, Howell’s velocity increased:

Howell Speed

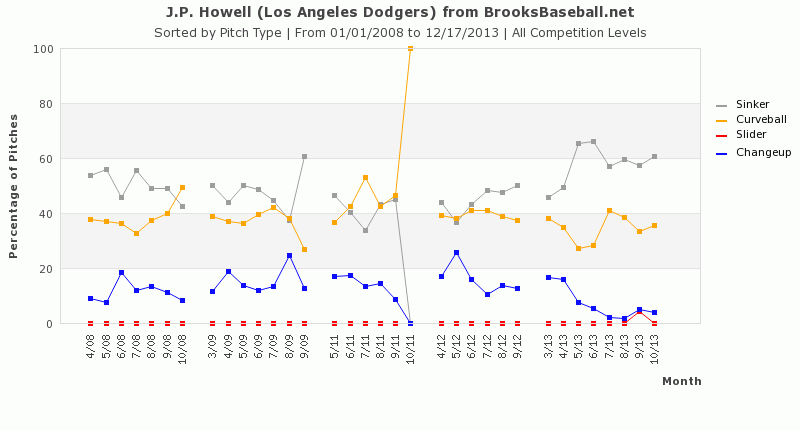
While Howell has never been a power pitcher, by the end of 2013 he was throwing his sinker faster than he ever has (or at least since Pitch F/X started tracking it). He also used it more than ever:

Howell Usage

Overall, he threw his sinker 58.55% of the time in 2013, up from a maximum of 50.18% in 2008, and a post-surgery maximum of 44.59% in 2012. He began phasing out his change-up almost entirely, and he lowered his curveball usage as well. When the sinker was put into play, it was a ground ball 62.3% of the time, the highest groundball rate on that pitch of his career (up from a previous high of 56.76% in 2011).

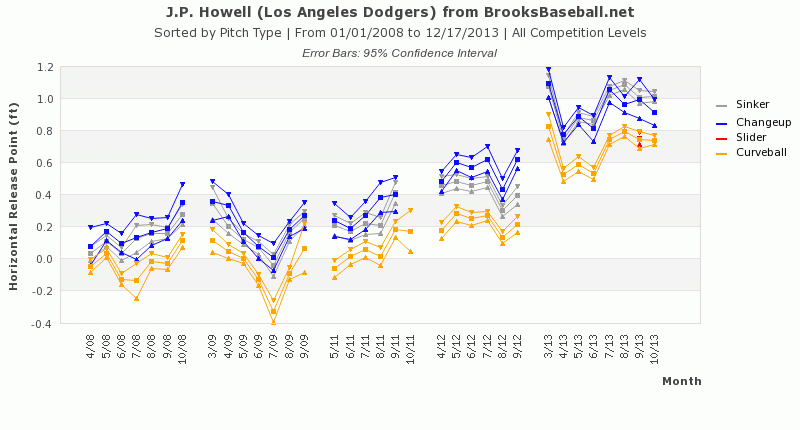
The other interesting change that I found was on Howell’s release point:

Howell Release Point

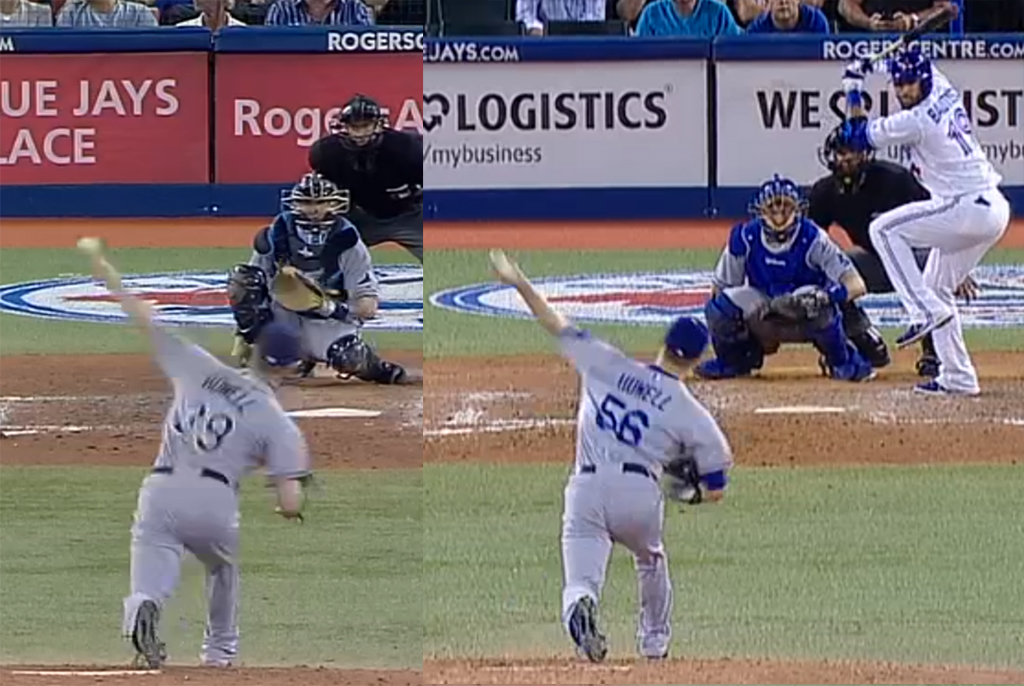
The chart shows a shift of release point towards the first base side of the rubber. I wanted to see if this due to a change in arm slot or a change in rubber position (or both), so I did a back-to-back comparison. Luckily, Howell pitched in Toronto in both 2012 and 2013 (same centerfield camera), so I was able to get a fairly close comparison:

Howell Comparison Large

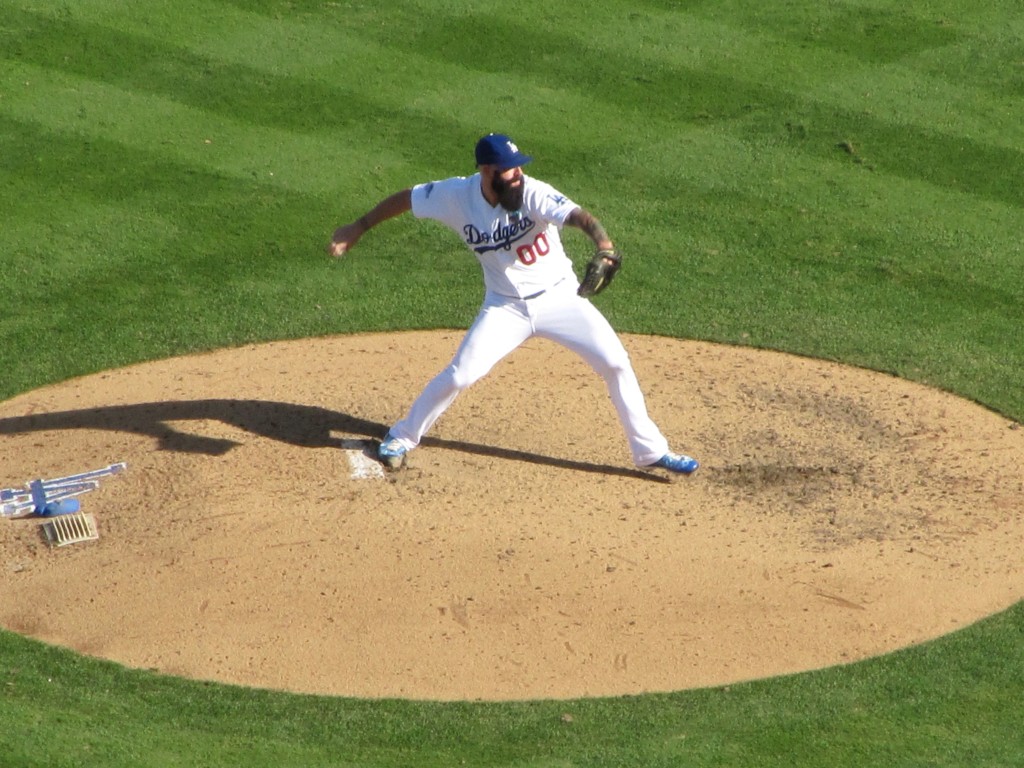
You can see that Howell is standing more towards the first base side. His arm slot is about the same; the Dodger frame is a few milliseconds behind the Rays frame. While not dramatic, it represents a small mechanical shift between 2012 and 2013.

One of the biggest changes in Howell’s results this year was that he limited homeruns. He allowed only 0.29 HR/9, and a 4.6% HR/FB ratio. Part of that could be due to the improved velocity and higher groundball rate on his sinker, but I did some additional investigation.

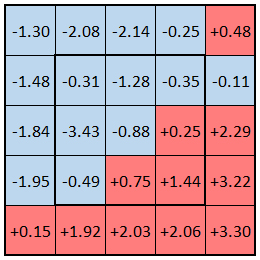
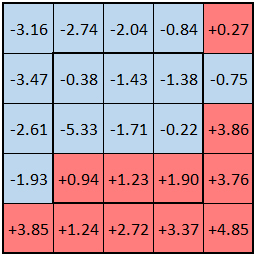
Below is a chart, using input data from the BrooksBaseball Pitch F/X location data. Instead of plotting the usage over each year, I took the output data and charted out the change in distribution from 2011-2012 to 2013. A negative number indicates that there are fewer pitches being thrown in the area, and a positive number indicates that more pitches being thrown in the area. The inner black box is the strike zone, and the chart is from the catcher’s perspective. The units are in change in percentage.

Zone Delta

The takeaway here is that he’s throwing fewer high pitches and more low pitches. Other than one square (high, off the plate on the left-hand side), Howell has reduced the count of pitches in all zones of the upper 2/5 of the charted area. Over the upper 2/5, he’s reduced the percentage of pitches by 8.82%. Over the lower 2/5, he’s increased the percentage of pitches by 12.43%.

This change would probably limit fly balls and fly ball distance to a certain degree, so it leads me to believe that Howell’s reduced home run rate is partially real. While the HR/FB ratio will probably increase, if Howell continues to pitch towards the bottom of the zone, his HR count should remain lower than it used to be.

Howell improved in 2013, and it looks like more than luck. What about the deal itself? To me, this seems like it’s a bit below the market rate for good but not great relievers. Joe Smith is right-handed and got three years and 15 million from the Angels. Howell had a better year in 2013, but Smith is probably a bit better overall. Last week, Boone Logan(another lefty) got three years and 16.5 million from the Rockies, despite the fact that Logan is more of a situational reliever than Howell.

Given those two deals, the contract for Howell seems just about right. It rewards Howell for the strides he made in 2013 without breaking the bank or giving him too many years. Going into the offseason, I was convinced that Howell was going to get three guaranteed years, so this seems like a win for the front office.

Update

Commenter JackedNate suggested that the change in pitch location distribution could be due to the simple fact that Howell threw his sinker more. This makes sense, so I decided to re-run the above strike zone distribution change map using just the location of the sinker:

Zone Delta Sinker Only

Surprisingly, the magnitude of the strike zone shifts is higher than the plot with all of his pitches. This means that Howell did a better job of getting his sinker lower in the zone in 2013 than he did in 2011-2012. In the upper 2/5 of the plot, he reduced the number of pitches by 15.91%, and in the lower 2/5, he increased the number of pitches by 21.92%.

Analyzing the Potential of Chris Perez

Note: I don’t like to put up transaction analyses before deal terms are known, so I’m going to focus on Perez himself. Since I’ll be travelling over the next few days, I won’t have a chance to put this post up later.

Last year, Brandon League had the second worst FIP in among relief pitchers with at least 50 innings pitched. The Dodgers apparently want the only pitch who was worse, as Dylan Hernandez is reporting that they close to signing Chris Perez to a one-year deal. Though Perez (9.0 K/9, 3.5 BB/9, 1.8 HR/9) took a much different path to his awful FIP than League did (4.6 K/9, 2.5 BB/9, 1.3 HR/9), each pitcher was worth approximately -1 fWAR in relief last season. Perez also had some significant (but kind of funny) off-field issues last year, but that’s not what I’m concerned with on this blog.

So, why was Perez so awful last season?

1. He was injured

Perez spent about a month on the disabled list last season with right (throwing) shoulder tendonitis. It’s possible that this impacted his results, since he had a few bad outings in a row before landing on the DL. This also means that the physical, which still needs to happen, is not a formality.

2. He didn’t throw as hard

Below is a chart of Perez’ pitch velocity from Brooks:

PerezVelocitySmall

Overall, Perez’ fastball averaged 93.5 MPH in 2013, and 94.7 MPH in 2012, a drop of around 1.2 MPH. However, September was Perez’ worst month despite his fastball velocity being closer to normal. In 9-1/3 innings in September, Perez allowed 10 runs and batters had a .400/.490/.814 line against him.

3. He allowed harder contact

One of Perez’ main skills before last year was his ability to limit hits on balls in play. His career BABIP allowed is .256. Last year he allowed a BABIP of .294, a career high. This fluctuation wasn’t just bad luck:

PerezLiners

Perez allowed an overall LD rate of 25.93%, per Brooks’ data. This is a career high by a significant margin; his second highest was 22.94% in 2010, his only other season above 20%.

4. Dingers!

Perez had a severe home run problem in 2013. He allowed 11 homers in 54 innings pitched last season. The move from Cleveland to LA won’t help him much, since the stadiums have similar home run park factors.

A regression in Perez’ HR/FB ratio could potentially help him next season. In 2013, Perez allowed a HR/FB rate of 20.0%. This was the highest by any relief pitcher with at least 50 innings pitched (Brandon League was second, with 19.0%). The statistic xFIP uses FIP and normalizes a pitcher to a league average HR/FB ratio, which is usually around 10%. Chris Perez’ xFIP last season was 3.83, about 1.2 runs below his FIP. His xFIP- was 97, slightly better than league average.

However, there’s evidence that this HR/FB ratio wasn’t just a fluke. From 2008-2012, Perez’ HR/FB ratio was 8.33%. Per Baseball Heat Maps, Perez’ average batted ball distance on fly balls and home runs in 2008-2012 was 277.9 feet. In 2013, the average distance jumped to 301.0 feet. There are some small sample caveats with one season of data, but on the surface a higher HR/FB ratio does make sense.

5. He wasn’t very good in the first place

Perez seems like a stereotypical “Proven Closer” guy. He’s had an up-and-down career, but his career FIP- is 102 and his career xFIP- is 100. That means that his peripherals are league average over the last six seasons. His best single-seaso FIP- is 84, which is decent. However, he’s only had two seasons with FIP-s below league average. In 2011, he had 36 saves despite a FIP- of 109 and XFIP- of 124.

To be fair, Perez’ ERA- is a bit better (85 career), but I don’t like using ERA to analyze relievers.

In my opinion, the Chris Perez signing has very high risk and limited upside. It doesn’t make much sense to me to add another reliever who just had a Brandon League-esque year, even if it’s only on a one year deal. Essentially, Perez can be viewed as a replacement for Ronald Belisario in the bullpen. Belisario has been erratic at best, but he’s never had a year as bad as Perez’ 2013. If I had to pick between the two, I would have stuck with Belisario.

With this signing, the 2014 bullpen is likely finalized, and looks like this:

Jansen/Wilson/Withrow/Perez/Howell/Rodriguez/League

I’m okay with having Jose Dominguez et al start in the minors, but Perez seems like an especially risky way to replace them. Along with the way that Paco Rodriguez finished the season, Chris Withrow‘s peripherals, Brian Wilson‘s health, and the fact that Brandon League still exists, the bullpen is filled with players that have the potential to not pan out in 2014. Bullpens are historically volatile, but Don Mattingly will need to watch this group closely.

More on Brian Wilson’s strikeouts

Brian Wilson’s strikeouts

One of the most fun aspects of this blog (for me) is that I’m learning as I write. Digging further into the statistics on my own is exposing me to new things that I wasn’t expecting. Sometimes, this results in me getting an answer that isn’t as complete as it should be. In the comments in my last piece about Brian Wilson‘s strikeouts, Amy (@SpaceDodgers) pointed out that I did not account for the atbat continuing after a looking strike (that resulted in a looking strikeout) was called a ball. This is a good point, and I’ve adjusted my methods a bit as a result.

The first step was to find out what counts Wilson’s looking strikeouts occurred on. Thanks to baseball reference’s play-by-play data, this task was relatively simple:

Count

Looking strikeouts

0-2

1

1-2

1

2-2

8

3-2

1

Total

11

As I found in the last post, Wilson’s career looking strikeout rate is 31.7%. So, given that he got 10 strikeouts swinging, 11 strikeouts would become 4.65. The rest of the at-bats would continue with one additional ball.

In order to determine what would happen if the at-bat continued, I used baseball reference’s average count splits for Wilson:

Split

PA

HR

BB

HBP

SO

BABIP

After 1-2

473

3

28

4

209

0.281

After 2-2

401

4

50

2

156

0.323

Full Count

278

3

72

1

95

0.393

If a looking strikeout on 0-2 was called a ball (which would occur in the percentage of atbats that did not end in a looking strikeout), then I used the split for results after a 1-2 count. 1-2 became 2-2, 2-2 became 3-2, and 3-2 became a walk.

Here are the results of the adjusted numbers, by count:

Looking K count

Stays looking K

K later in atbat

BB later

HBP later

HR later

In play later

In play, hit later

0-2

0.42

0.26

0.03

0.00

0.00

0.28

0.08

1-2

0.42

0.22

0.07

0.00

0.01

0.27

0.09

2-2

3.38

1.58

1.20

0.02

0.05

1.78

0.70

3-2

0.42

0.00

0.58

0.00

0.00

0.00

0.00

Total

4.65

2.06

1.88

0.02

0.06

2.33

0.87

Given the total change that this adjustment has, I also adjusted Wilson’s IP total. Since the model had 0.87 more hits, 1.88 more walks, 0.02 more HBP, and 0.06 more HR, Wilson would record 2.83 fewer outs if facing the same number of batters. That would adjust his IP count to 18.72 (down from the 19.67 he actually pitched).

Here’s a summary of Wilson’s overall stats, showing the actual results, the old regression method, and the new regression method:

K%

K/9

BB%

BB/9

FIP

FIP-

xFIP

xFIP-

Actual

28.8

9.61

8.2

2.75

2.02

56

2.82

75

Old regression

20.1

6.70

8.2

2.75

2.47

69

3.24

85

New regression

22.3

8.03

10.7

3.60

2.57

72

3.39

89

This new method isn’t quite as friendly to Wilson as the previous method. While his strikeouts go up, so do his walks. This results in a higher FIP and xFIP than he had previously. I also calculated FIP- and xFIP- (which I didn’t have before). Even with the new regression, Wilson is an above average pitcher, but not nearly as lights-out as his career peak.

There are still a few problems with these methods. The sample size of Wilson’s 2013 season is pretty small, so this is not an accurate way of projecting Wilson next year. The source data might represent a higher than average level of competition, since 1/3 of the data occured during the postseason. The samples on Wilson’s count splits are pretty small, too. There’s also the possibility that different counts lead to different rates of looking strikeouts (it is already known that different counts have different strike zone sizes). Using Wilson’s career average as opposed to the league average might be a mistake, given changes in run environment, Wilson’s injuries, and the uneven nature of his previous career.

Overall, though, this method gives a bit of a better picture of what happened with Wilson last year. He’s not going to continue getting 50% of his strikeouts looking, so it was fun to see what would have happened if he didn’t.

Clayton Kershaw is a Very Rich Man

Clayton Kershaw

Finally, finally, FINALLY, the Dodgers have secured the future of Clayton Kershaw. It took them long enough. After getting close  last season, and again during the season, the Dodgers and Kershaw have reportedly agreed to a 7 year, 215 million dollar contract. The deal also has an opt-out five years into the contract, but I’ll have more on that in a second.

The deal only covers Kershaw’s age 26-32 seasons, which is pretty great. In the rumors leading up to this, numbers like 10 years, 300 million and even 12 years, 300 million were thrown around. Earlier today, Dave Cameron examined comparable pitchers to Kershaw, and came away with either 7/230 or 8/250 being the approximate fair value. There’s obviously a lot of risk when giving out this kind of a contract to a pitcher, but since Kershaw is so young and has been so consistently amazing, the potential reward is huge. Plus, even if something does go wrong, at least Kershaw will put the money to good use. 215 million dollars builds a lot of orphanages.

On the opt-out: I’m not worried about it. If Kershaw opts out, it will be after his age 30 season, and it means that he would have provided a lot of value over the initial portion of the contract. If he departs, the Dodgers don’t have to worry about paying Kershaw 30MM per year in his 30s. It’s good for Kershaw, and it isn’t terrible for the Dodgers. As long as the two sides are still amicable in five years, it seems possible that they’ll use the opt-out as the starting point of another contract extension. This would be similar to what the Yankees and C.C. Sabathia did a few years ago.

This deal is great for Dodgers fans, too. In the last two decades, we’ve had to watch Pedro Martinez, Mike Piazza, and Adrian Beltre depart and become hall of famers wearing other hats. Kershaw has a great chance to be the best pitcher of this generation, and we get to see his best years as a Dodger. I’m normally pretty pessimistic, but I can’t see this contract as anything other than a huge win for everyone involved.

Big news!

Fireworks Post Header

You guys have probably noticed that I’ve been pretty quiet lately. It’s the offseason. I’ve been busy, and the Dodgers haven’t (until Wednesday). There’s more to the silence than that, though.

It’s weird that I have big personal news the hour before the Dodgers are going to officially announce the biggest team news since Guggenheim bought the team. But here we are. You’ve probably seen major news being teased around the Dodger blogger community, and today I can say that I’m involved.

Mike Petriello, Chad Moriyama, Dustin Nosler, and I are proud to announce Dodgers Digest, a new Dodgers blog. It will be located at DodgersDigest.com, and is officially launching on Monday. I’m really excited for the opportunity to be a part of this team, since we all have different strengths that we can draw from. We’ll be working as hard as possible to provide the best coverage possible. My role will be to write posts similar to what I have done here, though I’ll be helping out with site features and game threads as well.

In order to focus on the new site, most writing at Blog to the Score will stop. I’ll renew the hosting for at least another year, so my posts will remain archived here. I might post here occasionally if there’s something non-Dodgers related that I want to write about, but I’ll be sure to point people here if that happens.

Finally, I’d like to take a moment to thank my readers. Without your support, this opportunity wouldn’t be possible. Thanks for bearing with me as I learn, and I hope I can bring you even better content at Dodgers Digest.